As someone who’s been working with Wazuh for a while, I’ve come to rely on its powerful capabilities for monitoring and security. Initially, I had the Office 365 (O365) integration enabled in my Wazuh setup. However, I quickly realized that my needs went beyond what O365 integration could offer. Specifically, I wanted to track user logins that bypassed Multi-Factor Authentication (MFA). The O365 integration fell short in delivering the detailed information I needed.
This led me down a rabbit hole, where I discovered that Wazuh offers two different integrations for Office 365 services: the O365 integration and the Microsoft Graph API (MS-Graph) integration. The MS-Graph integration is newer and, as it turns out, better suited for capturing detailed security data, such as MFA usage during login events.
Realizing the Need for MS-Graph API Integration
At first glance, it wasn’t obvious that one might need to use both integrations, or perhaps even switch entirely to MS-Graph. The documentation could have been clearer on this, but after much digging and forum searching, I discovered that the MS-Graph API integration provides access to a broader set of data, including critical security logs that the O365 integration does not cover. I have previously toyed with the MS Graph developer explorer online https://developer.microsoft.com/en-us/graph/graph-explorer and this was very helpful in figuring out if the documentation that I was following was accurate, and even if any ChatGPT suggestions were out of whack.
My Initial Setup with MS-Graph
After realizing that MS-Graph was the way to go, I decided to set it up. Below is a sample configuration that I used in my ossec.conf file: (note, that this is not a working version, as you will see below)
<ms-graph>
    <enabled>yes</enabled>
    <only_future_events>no</only_future_events>
    <curl_max_size>10M</curl_max_size>
    <run_on_start>yes</run_on_start>
    <interval>1m</interval>
    <version>v1.0</version>
    <api_auth>
        <tenant_id>xyz</tenant_id>
        <client_id>xyz</client_id>
        <secret_value>xyz</secret_value>
        <api_type>global</api_type>
    </api_auth>
    <resource>
        <name>security</name>
        <relationship>alerts_v2</relationship>
        <relationship>incidents</relationship>
        <relationship>threatIntelligence</relationship>
    </resource>
    <resource>
        <name>auditLogs</name>
        <relationship>signIns</relationship>
        <relationship>provisioning</relationship>
    </resource>
</ms-graph>
This configuration is pretty straightforward, but there’s a catch. For each resource you configure, you also need to enable the corresponding API permissions in Microsoft Entra (formerly Azure AD). This step is crucial, as without the correct permissions, Wazuh won’t be able to pull the data you need.
The Frustrating Forbidden Error
After setting up the configuration and approving all necessary permissions in Entra, I hit a wall. I kept getting the following error in Wazuh:
Received unsuccessful status code when attempting to get relationship 'alerts_v2' logs: Status code was '403' & response was '{"error":{"code":"Forbidden","message":"Missing application roles. API required roles: SecurityAlert.Read.All,SecurityAlert.ReadWrite.All,SecurityIncident.Read.All,SecurityIncident.ReadWrite.All"}}
This error was frustrating, to say the least. After digging deeper, I realized that not all endpoints were supported by the MS-Graph API in Wazuh. I had to simplify my configuration by limiting it to only alerts, incidents, and signIns. (Originally I tried to add “Users”, “Provisioning”, and “Threat Inteligence”) This adjustment finally got it working, but with a caveat—I only received one alert.
    <resource>
        <name>security</name>
        <relationship>alerts_v2</relationship>
        <relationship>incidents</relationship>
    </resource>
    <resource>
        <name>auditLogs</name>
        <relationship>signIns</relationship>
    </resource>
Fine-Tuning the Configuration
With the integration technically working, I noticed that I was still only getting a single alert. After some more investigation, I found an open GitHub issue where another user mentioned a potential bug. The workaround? Increasing the scan interval.
I updated the interval in my configuration to 15 minutes:
<interval>5m</interval>This change led to some success—I received one alert. It was an incident alert, but only one.
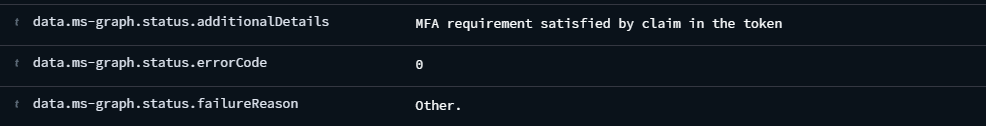
After further investigation, I realized that incident alerts were the only data I was receiving with the current configuration. The root cause was a known issue with the index mapping included in Wazuh 4.8. Specifically, the ms-graph.status field was mapped as a keyword, even though it could contain an array. This means it ideally needs to be mapped out separately, or map it as an object.
A keyword field accepts only string values, but the status field in Microsoft audit logs can sometimes be an array. Although the logs were being ingested into Wazuh, the OpenSearch dashboard was unable to decode the status field when it appeared as an array. This led to errors with Filebeat, the service responsible for reading log files and forwarding the data to Wazuh.
To diagnose the issue, I ran the following command:
less /var/log/filebeat/filebeat* | grep -i ms-graph
The output indicated parsing errors like this:
2024-09-13T13:06:47.184Z WARN [elasticsearch] elasticsearch/client.go:408 Cannot index event publisher.Event{Content:beat.Event{Timestamp:time.Time{wall:0xc1b12c1988c13bf4, ext:17625307611349, loc:(*time.Location)(0x42417a0)}, Meta:{"pipeline":"filebeat-7.10.2-wazuh-alerts-pipeline"}, Fields:{"agent":{"ephemeral_id":"839351e7-dc76-4441-a71d-f7df15086b66","hostname":"wazuh","id":"76c18fd0-3ab2-4531-a636-281276702205","name":"wazuh","type":"filebeat","version":"7.10.2"},"ecs":{"version":"1.6.0"},"event":{"dataset":"wazuh.alerts","module":"wazuh"},"fields":{"index_prefix":"wazuh-alerts-4.x-"},"fileset":{"name":"alerts"},"host":{"name":"wazuh"},"input":{"type":"log"},"log":{"file":{"path":"/var/ossec/logs/alerts/alerts.json"},"offset":397576256},"message":"{\"timestamp\":\"2024-09-13T13:06:40.269+0000\",\"rule\":{\"level\":3,\"description\":\"Azure: AD \",\"id\":\"87802\",\"firedtimes\":4,\"mail\":false,\"groups\":[\"azure\"]},\"agent\":{\"id\":\"000\",\"name\":\"wazuh\"},\"manager\":{\"name\":\"wazuh\"},\"id\":\"1726232800.511177205\",\"decoder\":{\"name\":\"json\"},\"data\":{\"id\":\"xxxx\",\"createdDateTime\":\"2024-09-13T12:53:47Z\",\"userDisplayName\":\"xxxx\",\"userPrincipalName\":\"xxxx\",\"userId\":\"xxxx\",\"appId\":\"xxxx\",\"appDisplayName\":\"Office 365 SharePoint Online\",\"ipAddress\":\"xxxx\",\"correlationId\":\"xxxx\",\"conditionalAccessStatus\":\"notApplied\",\"isInteractive\":\"true\",\"riskDetail\":\"none\",\"riskLevelAggregated\":\"none\",\"riskLevelDuringSignIn\":\"none\",\"riskState\":\"none\",\"riskEventTypes\":[],\"riskEventTypes_v2\":[],\"resourceDisplayName\":\"Office 365 SharePoint Online\",\"resourceId\":\"xxxx\",\"status\":{\"errorCode\":\"0\",\"failureReason\":\"Other.\",\"additionalDetails\":\"null\"},\"deviceDetail\":{\"operatingSystem\":\"Windows10\",\"browser\":\"Firefox 115.0\",\"isCompliant\":\"false\",\"isManaged\":\"false\"},\"location\":{\"city\":\"xxxx\",\"state\":\"xxxx\",\"countryOrRegion\":\"xx\",\"geoCoordinates\":{\"altitude\":\"null\",\"latitude\":\"xxxx\",\"longitude\":\"xxxx\"}},\"appliedConditionalAccessPolicies\":[],\"azure_tag\":\"azure-ad-graph\",\"azure_aad_tag\":\"azure-active_directory_signIns\"},\"location\":\"Azure\"}","service":{"type":"wazuh"}}, Private:file.State{Id:"native::4733292-2050", PrevId:"", Finished:false, Fileinfo:(*os.fileStat)(0xc000138820), Source:"/var/ossec/logs/alerts/alerts.json", Offset:397577715, Timestamp:time.Time{wall:0xc1b11ae3e39ac2ba, ext:2758074846, loc:(*time.Location)(0x42417a0)}, TTL:-1, Type:"log", Meta:map[string]string(nil), FileStateOS:file.StateOS{Inode:0x48396c, Device:0x802}, IdentifierName:"native"}, TimeSeries:false}, Flags:0x1, Cache:publisher.EventCache{m:common.MapStr(nil)}} (status=400): {"type":"mapper_parsing_exception","reason":"failed to parse field [data.status] of type [keyword] in document with id 'DOF-65EBex2hI56VRrbw'. Preview of field's value: '{failureReason=Other., errorCode=0, additionalDetails=null}'","caused_by":{"type":"illegal_state_exception","reason":"Can't get text on a START_OBJECT at 1:1166"}}The error was caused by a parsing exception due to the status field being treated as a keyword when it was, in fact, an object. Fortunately, Wazuh version 4.9 was expected to address this issue, and it was released just a week later. I decided to wait for the update.
Upgrading to Wazuh 4.9: Challenges and Resolutions
The upgrade process came with its own set of challenges. Although most issues were resolved through discussions in the Wazuh Slack channel—a fantastic resource—I encountered a persistent problem where all services started correctly, but the dashboard displayed the message “Dashboard not ready.”
After some troubleshooting, I discovered that Wazuh had made changes to the keystore, requiring an updated password for the kibanaserver user, which is essential for the dashboard’s functionality. Here’s how I resolved it:
- Update the password for the
kibanaserveruser:/usr/share/wazuh-indexer/plugins/opensearch-security/tools/wazuh-passwords-tool.sh -u kibanaserver -p '<NEW_PASSWORD>'
- Add the new password to the OpenSearch Dashboards keystore:
echo <KIBANASERVER_PASSWORD> | /usr/share/wazuh-dashboard/bin/opensearch-dashboards-keystore --allow-root add -f --stdin opensearch.password
- Restart the Wazuh dashboard:
systemctl restart wazuh-dashboard
Addressing Performance Issues with Shards
During the upgrade, I also discovered a performance bottleneck caused by having nearly 900 shards on a single node. To put it simply, it was like having one person search an entire library instead of a team of people. The solution was to either increase the number of nodes (additional VMs or servers) or reduce the shard count by implementing retention policies.
Miguel Casares from Wazuh recommended reducing the number of shards to one per index in the Filebeat template:
- Modify the Filebeat template:
vi /etc/filebeat/wazuh-template.json
- Change the
index.number_of_shardssetting:"settings": { "index.refresh_interval": "5s", "index.number_of_shards": "1", "index.numb"settings": {
"index.refresh_interval": "5s",
"index.number_of_shards": "1",
"index.number_of_replicas": "0",
"index.auto_expand_replicas": "0-1",
"index.mapping.total_fields.limit": 10000,
"index.query.default_field": [er_of_replicas": "0", "index.auto_expand_replicas": "0-1", "index.mapping.total_fields.limit": 10000, "index.query.default_field": [
- Restart Filebeat:
systemctl restart filebeat
- Reduce the number of shards by deleting old indices and implementing Index Lifecycle Management (ILM) policies:
- Deleting old indices: Elastic documentation
- Setting up ILM policies: Wazuh documentation
The Outcome
After roughly 15 hours of fine-tuning, we were back up and running with Wazuh v4.9. However, when I turned my attention back to those pesky MS-Graph logs, I found myself waiting and waiting… but still, no logs appeared.
It seemed the journey was not yet over.
It turns out I wasn’t the only one encountering this issue! Similar problems were highlighted in these GitHub posts:
After reading through these discussions, it became clear that this issue also affects the Azure Wodle integration in Wazuh. In particular, the mapping problem with the ms-graph.status field needed attention.
Implementing a Temporary Fix
Determined to resolve the issue, I decided to apply a temporary fix myself. The workaround involved modifying the mapping in the wazuh-template.json file to change the ms-graph.status field from a keyword to an object. Here’s what I did:
Old Mapping:
"status": {
  "type": "keyword"
}
New Mapping:
"status": {
  "type": "object",
  "dynamic": true
}
This change allowed the status field to be treated as an object, which accommodates both string and array values. While this adjustment resolved the immediate issue of log parsing errors, it wasn’t a perfect solution.
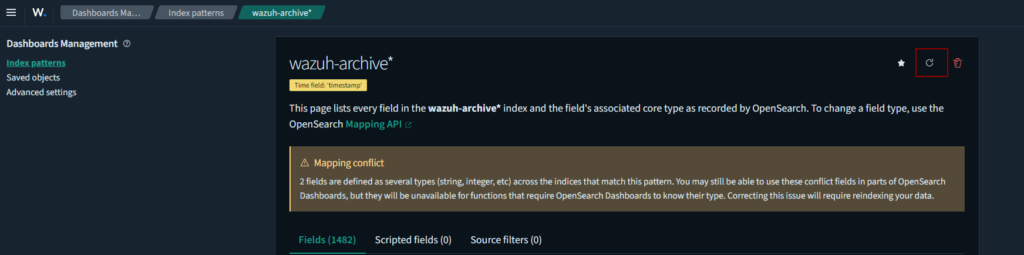
The last thing I had to do was refresh the field list in wazuh, that way each of the fields that it picks up are able to be seen individually (otherwise it will just appear as a json array).
Official Recommendation: Modifying the Azure Logs Parser
The official recommendation from the Wazuh team, as detailed in their GitHub pull request, involves adjusting the azure-logs.py file. This change improves the way the status field is handled across the board, providing a more robust and long-term fix compared to just altering the template. However this only resolves the issue if you are using the Azure wodle, not the Ms-Graph integration.
The Results
After implementing the changes, I restarted the dashboard and waited for a new index to generate—typically the following day. Once the new index was active, I could finally see the ms-graph.status field appearing correctly in the dashboard.
This process underscored the importance of community input and collaboration in identifying and resolving issues quickly. Despite the initial headaches, these collective efforts allowed me to achieve a fully functional MS-Graph integration in Wazuh.
The only issue with this solution is that it does not factor in the possibility that ms-graph.status could still be a keyword on its own.
Conclusion
Installing and configuring Wazuh’s MS-Graph API integration was a bit of a rollercoaster. It seems more like a BETA integration rather then a production ready ingestion. Be prepared for some trial and error, and don’t forget to tweak your settings, such as the scan interval.
For more detailed guidance, you can check out the Wazuh documentation on MS-Graph integration and the related GitHub issue1 GitHub issue2 GitHub issue3 GitHub issue4 and I encountered.
Resources
- https://documentation.wazuh.com/4.8/user-manual/reference/ossec-conf/ms-graph-module.html
- https://documentation.wazuh.com/current/cloud-security/ms-graph/monitoring-ms-graph-activity.html
- https://documentation.wazuh.com/current/user-manual/reference/ossec-conf/index.html
- https://github.com/wazuh/wazuh-documentation/tree/a9f6d1c2e8ac69021101342d08ca894bf7a1b2eb/source/cloud-security/ms-graph